
- Important Facts
- Data Views
- by race/ethnicity and age, Utah, 2021-2022
- by year, Utah, 2015-2022
- by race/ethnicity, Utah, 2022
- by age groups: 0-4, 5-14, 15-34, 35-64 and 65+, Utah, 2022
- by age and sex, Utah, 2021-2022
- by local health district, Utah, 2021-2022
- by Utah Small Area, 2021-2022
- average charge per visit by local health district, Utah, 2022
- average charge per visit by year, Utah, 2012-2022
- total charges by local health district, Utah, 2022
- Related Indicators
- Available Services
- Other Resources & Links
- Full Report
- Main XML Data
- Values XML Data


Complete Health Indicator Report of Asthma-related Emergency Department (ED) Visits
Definition
Rate: Emergency department visits due to asthma per 10,000 Utah residents. [[br]] Number: Emergency department visits due to asthma.Numerator
Rate/number: Number of emergency department visits among the Utah population with asthma as the principle diagnosis.Denominator
Rate: Utah population. [[br]] Number: Not applicable.Data Interpretation Issues
Several studies unexpectedly found a reduction in pediatric asthma emergency department (ED) visits during the first year of the COVID-19 pandemic in 2020 (1-3). These studies concluded public health measures like social distancing, mask-wearing, school closures, and stay-at-home orders resulted in reduced exposure to respiratory viruses and reduced asthma exacerbations, and therefore a decline in rates of asthma ED visits (1-3). 1. Arsenault S, Hoofman J, Poowuttikul P, Secord E. Sustained decrease in pediatric asthma emergency visits during the first year of the COVID-19 pandemic. Allergy Asthma Proc. 2021; 42(5): 400-402. [https://www.ncbi.nlm.nih.gov/pmc/articles/PMC8677502/] 2. Ulrich L, Macias C, George A, Bai S, Allen E. Unexpected decline in pediatric asthma morbidity during the coronavirus pandemic. Pediatric Pulmonology. 2021; 56(7): 1951-1956. [https://onlinelibrary.wiley.com/doi/full/10.1002/ppul.25406] 3. Akelma Z, Baskaya N, Cetin S, Bostanci I, Ozmen S. Improvement in school-aged children with asthma during the Covid-19 pandemic. Pediatric Pulmonology. 2022; 57(10): 2518-2523. [https://onlinelibrary.wiley.com/doi/full/10.1002/ppul.26068]Why Is This Important?
Asthma can usually be managed in an outpatient setting, reducing the need for emergency department visits. Tracking rates of emergency department visits can aid in identifying populations or areas with inadequate access to routine medical care. An asthma attack can necessitate an emergency department visit and can be initiated by a variety of triggers. Some of these include exposure to environmental tobacco smoke, dust mites, cockroach allergen, mold, pets, strenuous physical exercise, and air pollution. Two key air pollutants that can affect asthma are ozone (found in smog) and PM or particulate matter (found in haze, smoke, and dust). The majority of problems associated with asthma, including emergency department visits, are preventable if asthma is managed according to established guidelines. Effective management includes control of exposures to factors that trigger exacerbations, adequate pharmacological management, continual monitoring of the disease, and patient education in asthma care.How Are We Doing?
In 2022, Utah's overall emergency department visit rate due to asthma was 20.7 per 10,000 population (crude rate). Asthma emergency department visits per 10,000 were higher among male children aged 0-9 when compared to female children aged 0-9 (50.5 vs. 30.1). However, among those aged 10 years and older, females have a higher rate than males (20.8 vs. 13.7).What Is Being Done?
The Utah Asthma Program (UAP) works with the Utah Asthma Task Force and other partners to maximize the reach, impact, efficiency, and sustainability of comprehensive asthma control services in Utah. This is accomplished by providing a seamless alignment of asthma services across the public health and health care sector, ensuring that people with asthma receive all of the services they need. The UAP focuses on building program infrastructure and implementing strategies that improve asthma control, reduce asthma-related emergency department visits and hospitalizations, and reduce health care costs. Program infrastructure is strengthened through a focus on strategies to create and support a comprehensive asthma control program, these strategies include: strengthening leadership, building strategic partnerships, and using strategic communication, surveillance, and evaluation. In addition, the UAP implements strategies outlined in the Centers for Disease Control and Prevention (CDC) EXHALE technical package to improve asthma control. The six strategy areas outlined in the EXHALE technical package are:[[br]] 1. Education on asthma self-management.[[br]] 2. e-Xtinguishing smoking and secondhand smoke.[[br]] 3. Home visits for trigger reduction and asthma self-management.[[br]] 4. Achievement of guidelines-based medical management.[[br]] 5. Linkages and coordination of care across settings.[[br]] 6. Environmental policies or best practices to reduce asthma triggers from indoor, outdoor, and occupational sources. These strategies are expected to improve asthma control and quality of life by increasing access to health care and increasing coordination and coverage for comprehensive asthma control services both in the public health and health care sectors. Specifically, these strategies include identifying people with poorly controlled asthma, linking them to health care providers and NAEPP EPR-3 guidelines-based care, educating them on asthma self-management strategies, providing a supportive school environment, and referring to or providing home trigger reduction services for those who need them.Available Services
A list of Utah Asthma Program services for clinicians, community health workers, and people with asthma can be found here: [https://asthma.utah.gov/] Additionally, individual programs in the Office Health Promotion and Prevention provide information and education to citizens, physicians, and health care providers on chronic conditions. Resources can be found here: [https://dhhs.utah.gov/office-of-health-promotion-and-prevention/]Health Program Information
Utah Asthma Program website: [https://asthma.utah.gov/] CDC EXHALE package: [https://www.cdc.gov/national-asthma-control-program/php/exhale/index.html]Related Indicators
Related Relevant Population Characteristics Indicators:
- Air Quality: Ozone
- Air Quality: Particulate Matter (PM2.5)
- Asthma: Adult Prevalence
- Asthma: Child Prevalence
- Asthma-related Emergency Department (ED) Visits
- Asthma Hospitalizations
- Asthma Management
- Smoking Among Adults
- Smoking Among Adolescents
- Health Status: Mental Health Past 30 Days
- Immunization - Influenza, adults
- Immunizations - Pneumonia, adults
- Obesity Among Adults
- Obesity Among Children and Adolescents
Related Risk Factors Indicators:
Related Health Status Outcomes Indicators:
Graphical Data Views
Asthma-related emergency department visits by race/ethnicity and age, Utah, 2021-2022

| Age groups for asthma ED | Race/ethnicity group | Rate per 10,000 population | Lower Limit | Upper Limit | Note | |
|---|---|---|---|---|---|---|
Record Count: 30 | ||||||
| 0-4 | American Indian/Alaska Native | 30.7 | 20.2 | 44.6 | ||
| 0-4 | Asian | 14.1 | 8.6 | 21.8 | ||
| 0-4 | Black/African American | 85.2 | 66.6 | 107.3 | ||
| 0-4 | Hispanic/Latino | 38.9 | 35.2 | 42.9 | ||
| 0-4 | Native Hawaiian/Pacific Islander | 157.3 | 128.8 | 190.3 | ||
| 0-4 | White | 31.0 | 29.3 | 32.8 | ||
| 5-14 | American Indian/Alaska Native | 21.6 | 15.6 | 29.1 | ||
| 5-14 | Asian | 22.2 | 16.3 | 29.6 | ||
| 5-14 | Black/African American | 70.6 | 58.8 | 84.0 | ||
| 5-14 | Hispanic/Latino | 38.7 | 36.0 | 41.6 | ||
| 5-14 | Native Hawaiian/Pacific Islander | 66.6 | 53.9 | 81.3 | ||
| 5-14 | White | 20.3 | 19.4 | 21.2 | ||
| 15-34 | American Indian/Alaska Native | 21.2 | 16.6 | 26.7 | ||
| 15-34 | Asian | 6.1 | 4.4 | 8.4 | ||
| 15-34 | Black/African American | 46.9 | 40.4 | 54.1 | ||
| 15-34 | Hispanic/Latino | 25.5 | 23.8 | 27.2 | ||
| 15-34 | Native Hawaiian/Pacific Islander | 50.0 | 42.0 | 59.1 | ||
| 15-34 | White | 16.9 | 16.3 | 17.5 | ||
| 35-64 | American Indian/Alaska Native | 44.4 | 37.6 | 52.2 | ||
| 35-64 | Asian | 5.1 | 3.6 | 7.1 | ||
| 35-64 | Black/African American | 47.9 | 40.6 | 56.1 | ||
| 35-64 | Hispanic/Latino | 21.7 | 20.1 | 23.4 | ||
| 35-64 | Native Hawaiian/Pacific Islander | 61.2 | 51.7 | 72.0 | ||
| 35-64 | White | 13.8 | 13.3 | 14.3 | ||
| 65+ | American Indian/Alaska Native | ** | 6.7 | 25.8 | ** | |
| 65+ | Asian | 12.9 | 8.1 | 19.5 | ||
| 65+ | Black/African American | ** | 2.2 | 20.4 | ** | |
| 65+ | Hispanic/Latino | 17.8 | 14.4 | 21.9 | ||
| 65+ | Native Hawaiian/Pacific Islander | 61.6 | 41.6 | 88.0 | ||
| 65+ | White | 9.7 | 9.0 | 10.4 | ||
Data Notes
Asthma was identified using the National Center for Health Statistics (NCHS) 113 selected causes asthma definition. All ED encounters are included in the presented data, which includes those that were treat and release visits, as well as those that resulted in hospital admission. [[br]][[br]]Race and ethnicity categories are not mutually exclusive. **The estimate has been suppressed because 1) the relative standard error is greater than 50% or 2) the observed number of events is very small and not appropriate for publication.Data Sources
- Emergency Department Encounter Database, Healthcare Information & Analysis Programs, Office of Research & Evaluation, Utah Department of Health and Human Services
- Population Estimates by Age, Sex, Race, and Hispanic Origin for Counties in Utah, U.S. Bureau of the Census, IBIS Version 2022
Emergency department (ED) visits due to asthma by year, Utah, 2015-2022
 visits due to asthma by year, Utah, 2015-2022")
| Year | Age-adjusted ED visits per 10,000 | Lower Limit | Upper Limit | |||
|---|---|---|---|---|---|---|
Record Count: 7 | ||||||
| 2016 | 21.8 | 21.3 | 22.4 | |||
| 2017 | 20.4 | 19.9 | 20.9 | |||
| 2018 | 19.4 | 18.9 | 19.9 | |||
| 2019 | 19.6 | 19.1 | 20.1 | |||
| 2020 | 15.0 | 14.6 | 15.4 | |||
| 2021 | 17.8 | 17.4 | 18.3 | |||
| 2022 | 20.4 | 19.9 | 20.9 | |||
Data Notes
Asthma was identified using the National Center for Health Statistics (NCHS) 113 selected causes asthma definition. All ED encounters are included in the presented data, which includes those that were treat and release visits, as well as those that resulted in hospital admission. [[br]][[br]]Age-adjusted to the U.S. 2000 standard population. As of October 1, 2015, the U.S. is currently using the 10th revision of the International Classification of Diseases (ICD-10) to code hospitalizations and emergency department visits. Prior to the change, asthma hospitalizations and emergency department visits were defined as having an ICD-9 primary diagnosis code of 493. In the ICD-10 classification, asthma is defined using the J45 code. Comparison of data prior to the code change may not be appropriate.Data Sources
- Emergency Department Encounter Database, Healthcare Information & Analysis Programs, Office of Research & Evaluation, Utah Department of Health and Human Services
- For years 2020 and later, the population estimates are provided by the Kem C. Gardner Policy Institute, Utah state and county annual population estimates are by single year of age and sex, IBIS Version 2022
- Population Estimates for 2000-2019: National Center for Health Statistics (NCHS) through a collaborative agreement with the U.S. Census Bureau, IBIS Version 2020
Emergency department (ED) visits due to asthma by race/ethnicity, Utah, 2022
 visits due to asthma by race/ethnicity, Utah, 2022")
| Race/ethnicity group | Age-adjusted ED visits per 10,000 | Lower Limit | Upper Limit | |||
|---|---|---|---|---|---|---|
Record Count: 6 | ||||||
| American Indian/Alaska Native | 34.0 | 29.0 | 39.6 | |||
| Asian | 9.5 | 7.5 | 11.9 | |||
| Black/African American | 50.7 | 44.9 | 57.1 | |||
| Hispanic/Latino | 27.7 | 26.2 | 29.2 | |||
| Native Hawaiian/Pacific Islander | 69.8 | 61.4 | 79.1 | |||
| White | 17.4 | 17.0 | 17.9 | |||
Data Notes
Asthma was identified using the National Center for Health Statistics (NCHS) 113 selected causes asthma definition. All ED encounters are included in the presented data, which includes those that were treat and release visits, as well as those that resulted in hospital admission. [[br]][[br]]Race and ethnicity categories are not mutually exclusive. Age-adjusted to the U.S. 2000 standard population.Data Sources
- Emergency Department Encounter Database, Healthcare Information & Analysis Programs, Office of Research & Evaluation, Utah Department of Health and Human Services
- Population Estimates by Age, Sex, Race, and Hispanic Origin for Counties in Utah, U.S. Bureau of the Census, IBIS Version 2022
Emergency department (ED) encounters due to asthma by age groups: 0-4, 5-14, 15-34, 35-64 and 65+, Utah, 2022
 encounters due to asthma by age groups: 0-4, 5-14, 15-34, 35-64 and 65+, Utah, 2022")
| Age group | ED visits per 10,000 population | Lower Limit | Upper Limit | |||
|---|---|---|---|---|---|---|
Record Count: 5 | ||||||
| 0-4 | 42.4 | 39.8 | 45.1 | |||
| 5-14 | 28.0 | 26.6 | 29.5 | |||
| 15-34 | 20.9 | 20.0 | 21.8 | |||
| 35-64 | 16.1 | 15.4 | 16.8 | |||
| 65+ | 11.1 | 10.1 | 12.2 | |||
Data Notes
Asthma was identified using the National Center for Health Statistics (NCHS) 113 selected causes asthma definition. All ED encounters are included in the presented data, which includes those that were treat and release visits, as well as those that resulted in hospital admission.Data Sources
- Emergency Department Encounter Database, Healthcare Information & Analysis Programs, Office of Research & Evaluation, Utah Department of Health and Human Services
- For years 2020 and later, the population estimates are provided by the Kem C. Gardner Policy Institute, Utah state and county annual population estimates are by single year of age and sex, IBIS Version 2022
Emergency department (ED) visits due to asthma by age and sex, Utah, 2021-2022
 visits due to asthma by age and sex, Utah, 2021-2022")
| Males vs. Females | Age group | ED visits per 10,000 population | Lower Limit | Upper Limit | ||
|---|---|---|---|---|---|---|
Record Count: 10 | ||||||
| Male | 0-4 | 44.9 | 42.3 | 47.6 | ||
| Male | 5-14 | 27.5 | 26.2 | 28.9 | ||
| Male | 15-34 | 16.0 | 15.3 | 16.8 | ||
| Male | 35-64 | 12.4 | 11.8 | 13.1 | ||
| Male | 65+ | 7.4 | 6.5 | 8.3 | ||
| Female | 0-4 | 25.9 | 23.9 | 28.1 | ||
| Female | 5-14 | 19.0 | 17.8 | 20.2 | ||
| Female | 15-34 | 24.8 | 23.9 | 25.8 | ||
| Female | 35-64 | 20.1 | 19.3 | 21.0 | ||
| Female | 65+ | 13.6 | 12.6 | 14.8 | ||
Data Notes
Asthma was identified using the National Center for Health Statistics (NCHS) 113 selected causes asthma definition. All ED encounters are included in the presented data, which includes those that were treat and release visits, as well as those that resulted in hospital admission.Data Sources
- Emergency Department Encounter Database, Healthcare Information & Analysis Programs, Office of Research & Evaluation, Utah Department of Health and Human Services
- For years 2020 and later, the population estimates are provided by the Kem C. Gardner Policy Institute, Utah state and county annual population estimates are by single year of age and sex, IBIS Version 2022
Asthma-related emergency department visits by local health district, Utah, 2021-2022

| Local health district | Age-adjusted rate per 10,000 population | Lower Limit | Upper Limit | Note | ||
|---|---|---|---|---|---|---|
Record Count: 14 | ||||||
| Bear River | 14.8 | 13.6 | 16.0 | Lower than state | ||
| Central | 20.7 | 18.5 | 23.2 | Similar to state | ||
| Davis County | 16.8 | 15.8 | 17.7 | Lower than state | ||
| Salt Lake County | 22.8 | 22.2 | 23.4 | Higher than state | ||
| San Juan | 22.7 | 17.4 | 29.1 | Similar to state | ||
| Southeast | 27.1 | 23.4 | 31.2 | Higher than state | ||
| Southwest | 16.6 | 15.4 | 17.7 | Lower than state | ||
| Summit | 6.6 | 4.9 | 8.8 | Lower than state | ||
| Tooele | 27.0 | 24.5 | 29.8 | Higher than state | ||
| TriCounty | 30.2 | 27.0 | 33.6 | Higher than state | ||
| Utah County | 14.1 | 13.4 | 14.7 | Lower than state | ||
| Wasatch | 12.6 | 10.1 | 15.5 | Lower than state | ||
| Weber-Morgan | 23.8 | 22.5 | 25.1 | Higher than State | ||
| State of Utah | 19.1 | 18.7 | 19.5 | |||
Age-adjusted asthma emergency department visits by Utah local health district, 2020-2022
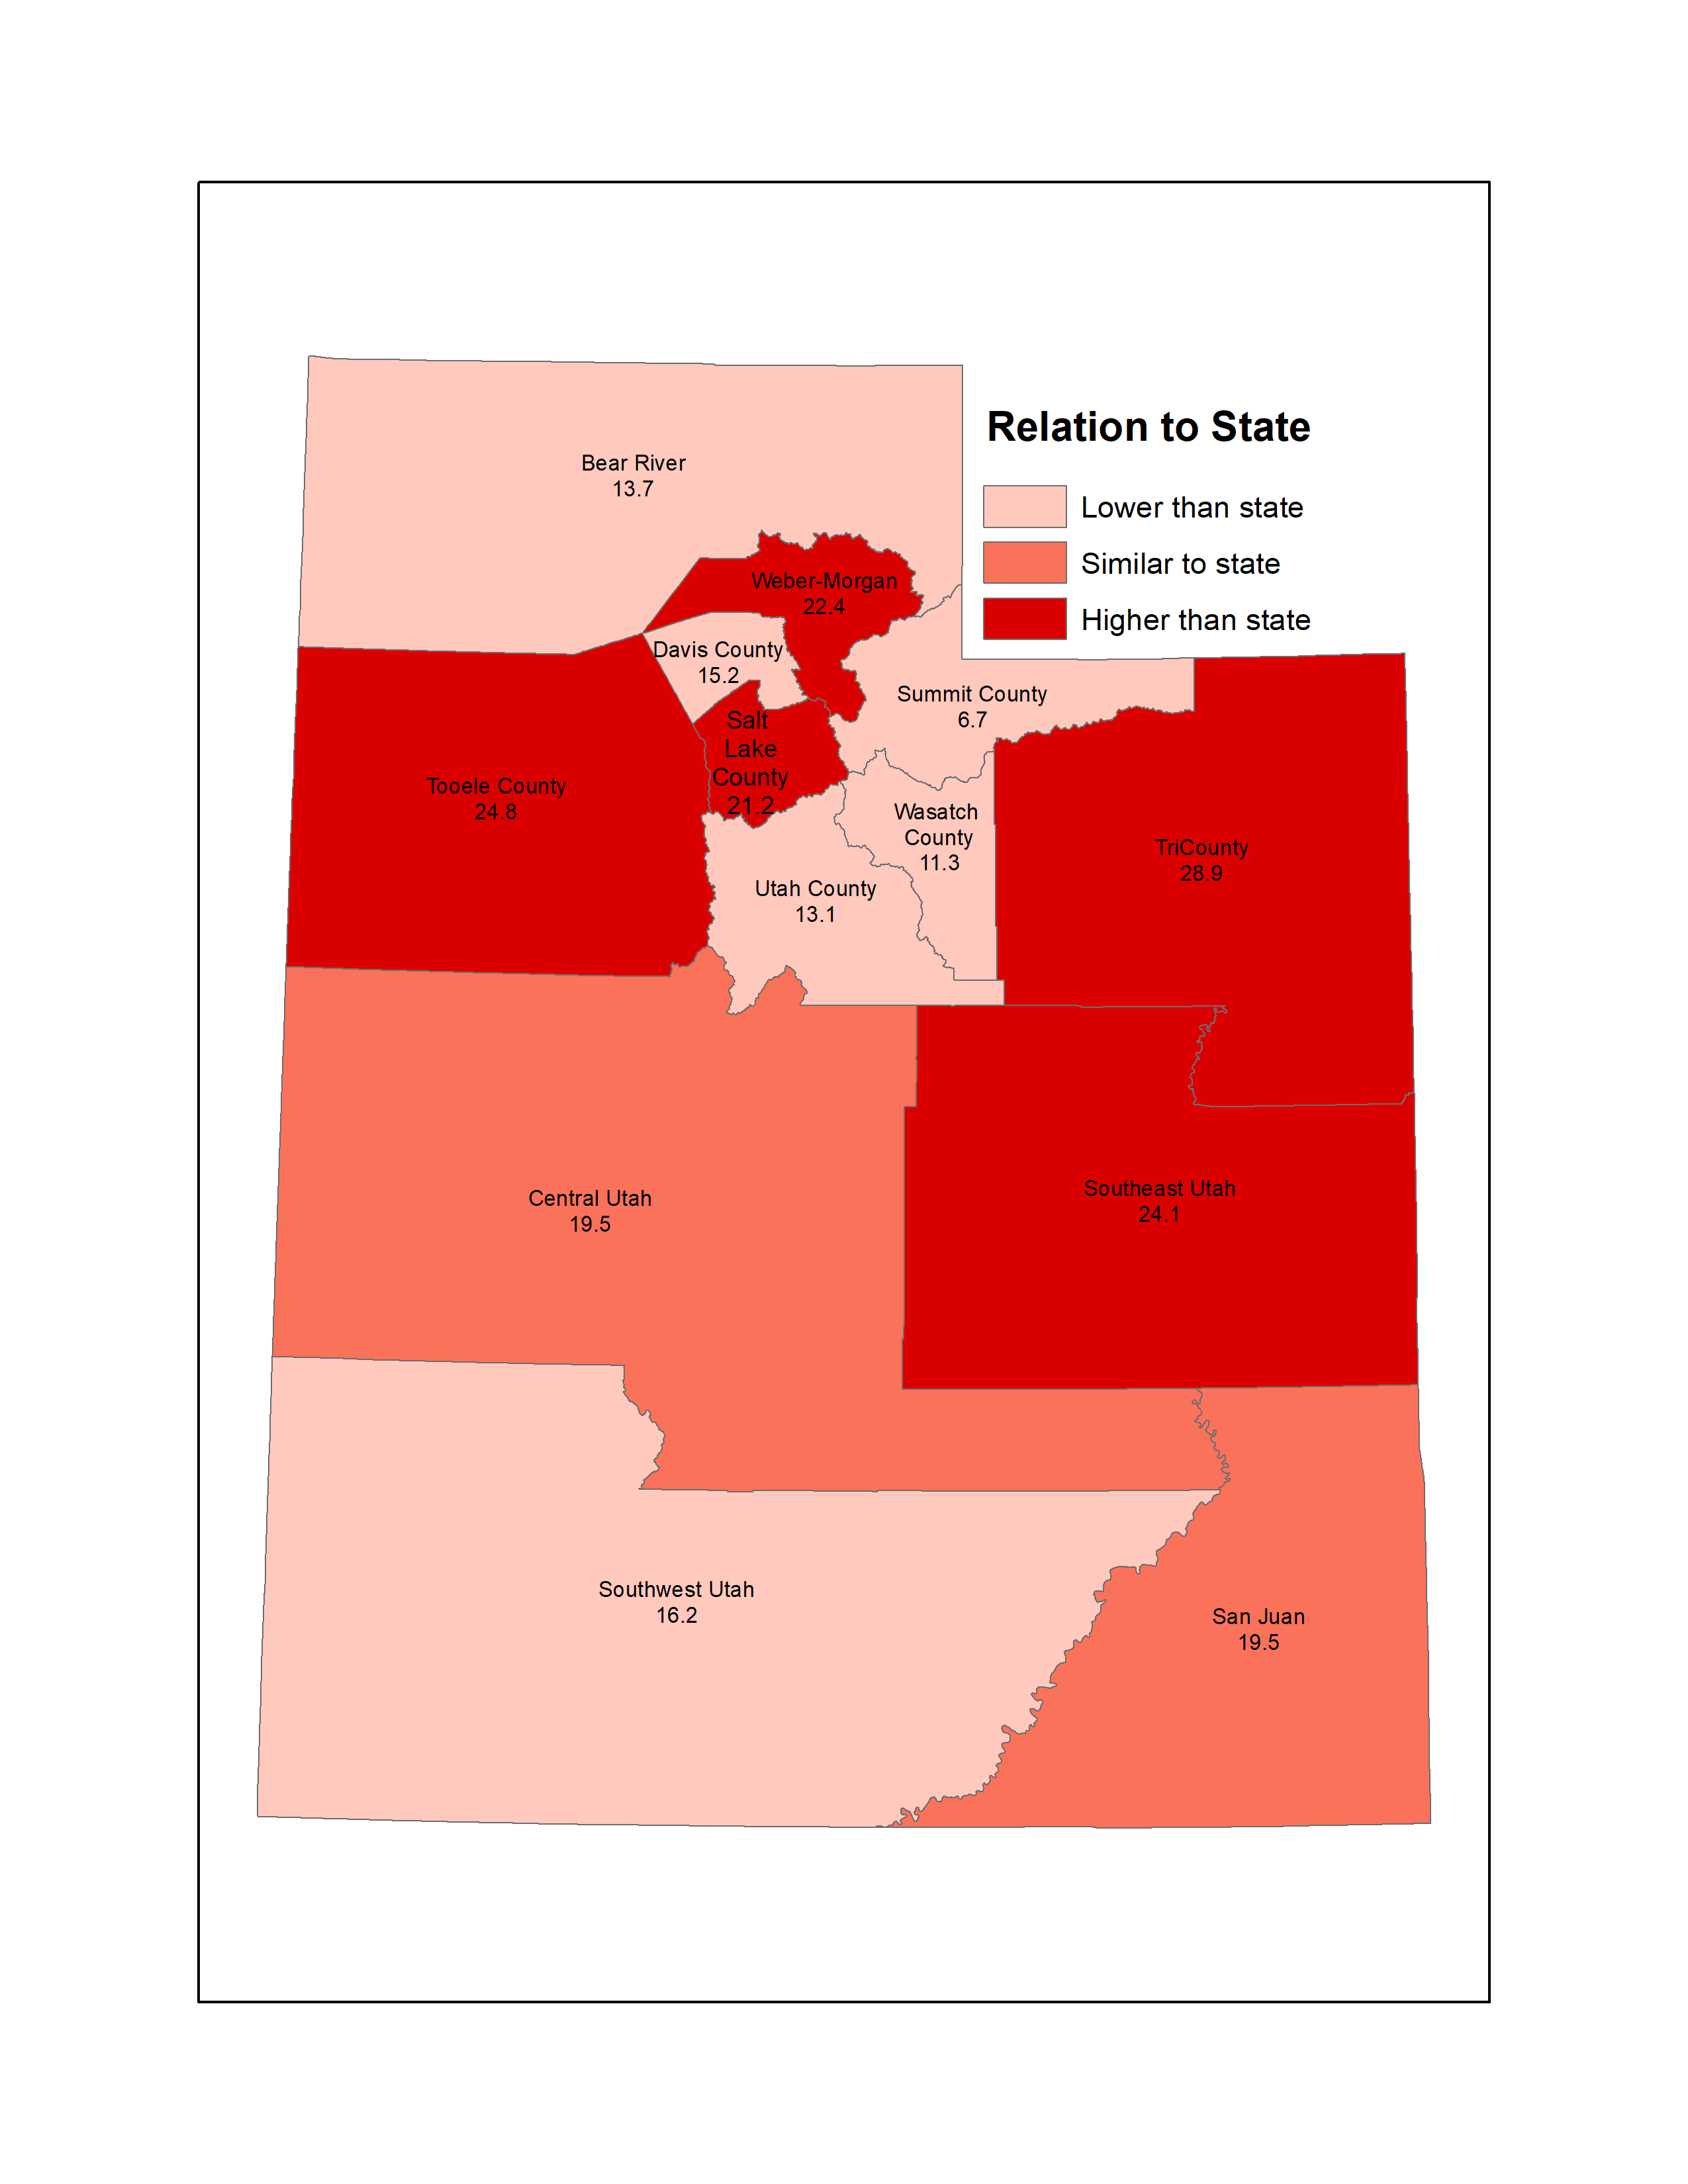
This map was made using a method called "fixed effect test of significance" where classes are based on statistically higher or lower rates than the state rate. This map contains 3 years of data so the numbers will be slightly different from the chart. This map also was created using different population estimates.
Data Notes
Asthma was identified using the National Center for Health Statistics (NCHS) 113 selected causes asthma definition. All ED encounters are included in the presented data, which includes those that were treat and release visits, as well as those that resulted in hospital admission. [[br]][[br]]Rates were age-adjusted to the U.S. 2000 standard population.Data Sources
- Emergency Department Encounter Database, Healthcare Information & Analysis Programs, Office of Research & Evaluation, Utah Department of Health and Human Services
- For years 2020 and later, the population estimates are provided by the Kem C. Gardner Policy Institute, Utah state and county annual population estimates are by single year of age and sex, IBIS Version 2022
Emergency department visits due to asthma by Utah Small Area, 2021-2022

| Utah Small Areas | Age-adjusted rate per 10,000 population | Lower Limit | Upper Limit | Note | ||
|---|---|---|---|---|---|---|
Record Count: 100 | ||||||
| Brigham City | 23.0 | 19.1 | 27.5 | Similar to state | ||
| Box Elder Co (Other) V2 | 23.0 | 17.5 | 29.7 | Similar to state | ||
| Tremonton | 24.2 | 19.4 | 29.8 | Higher than state | ||
| Logan V2 | 12.3 | 10.3 | 14.6 | Lower than state | ||
| North Logan | 14.3 | 11.1 | 18.2 | Lower than state | ||
| Cache (Other)/Rich (All) V2 | 8.4 | 6.1 | 11.3 | Lower than state | ||
| Hyrum | 9.1 | 5.3 | 14.6 | Lower than state | ||
| Smithfield | 9.2 | 6.2 | 13.1 | Lower than state | ||
| Ben Lomond | 24.0 | 21.5 | 26.9 | Higher than state | ||
| Weber County (East) | 13.3 | 10.8 | 16.1 | Lower than state | ||
| Morgan County | 7.8 | 4.8 | 12.1 | Lower than state | ||
| Ogden (Downtown) | 29.9 | 26.4 | 33.6 | Higher than state | ||
| South Ogden | 24.7 | 21.2 | 28.6 | Higher than state | ||
| Roy/Hooper | 25.5 | 22.4 | 28.8 | Higher than state | ||
| Riverdale | 29.2 | 24.8 | 34.1 | Higher than state | ||
| Clearfield Area/Hooper | 21.9 | 19.6 | 24.4 | Higher than state | ||
| Layton/South Weber | 19.4 | 17.4 | 21.5 | Similar to state | ||
| Kaysville/Fruit Heights | 10.4 | 8.3 | 12.9 | Lower than state | ||
| Syracuse | 13.0 | 10.5 | 16.1 | Lower than state | ||
| Centerville | 8.8 | 5.9 | 12.6 | Lower than state | ||
| Farmington | 11.1 | 8.3 | 14.5 | Lower than State | ||
| North Salt Lake | 19.2 | 15.2 | 23.9 | Similar to state | ||
| Woods Cross/West Bountiful | 15.8 | 11.8 | 20.9 | Similar to state | ||
| Bountiful | 16.0 | 13.5 | 18.8 | Similar to state | ||
| SLC (Rose Park) | 29.7 | 25.9 | 34.0 | Higher than state | ||
| SLC (Avenues) | 10.0 | 7.2 | 13.5 | Lower than state | ||
| SLC (Foothill/East Bench) | 11.5 | 8.4 | 15.3 | Lower than state | ||
| Magna | 31.3 | 27.0 | 36.0 | Higher than state | ||
| SLC (Glendale) V2 | 34.9 | 29.8 | 40.7 | Higher than state | ||
| West Valley (Center) | 32.9 | 29.4 | 36.7 | Higher than state | ||
| West Valley (West) V2 | 25.9 | 22.0 | 30.3 | Higher than state | ||
| West Valley (East) V2 | 42.6 | 38.8 | 46.7 | Higher than state | ||
| SLC (Downtown) V2 | 41.5 | 36.7 | 46.9 | Higher than state | ||
| SLC (Southeast Liberty) | 12.8 | 9.5 | 16.9 | Lower than state | ||
| South Salt Lake | 40.8 | 35.6 | 46.5 | Higher than state | ||
| SLC (Sugar House) | 18.0 | 15.0 | 21.4 | Similar to state | ||
| Millcreek (South) | 23.8 | 19.2 | 29.3 | Similar to state | ||
| Millcreek (East) | 11.5 | 8.6 | 15.1 | Lower than state | ||
| Holladay V2 | 21.4 | 17.3 | 26.2 | Similar to state | ||
| Cottonwood | 15.8 | 13.0 | 19.1 | Similar to state | ||
| Kearns V2 | 30.8 | 27.1 | 34.9 | Higher than state | ||
| Taylorsville (E)/Murray (W) | 30.2 | 26.3 | 34.4 | Higher than state | ||
| Taylorsville (West) | 25.5 | 22.0 | 29.4 | Higher than state | ||
| Murray | 31.3 | 27.4 | 35.6 | Higher than state | ||
| Midvale | 32.4 | 28.3 | 36.8 | Higher than state | ||
| West Jordan (Northeast) V2 | 27.2 | 23.2 | 31.7 | Higher than state | ||
| West Jordan (Southeast) | 22.5 | 19.2 | 26.1 | Similar to state | ||
| West Jordan (W)/Copperton | 16.0 | 13.2 | 19.1 | Similar to state | ||
| South Jordan V2 | 13.2 | 10.9 | 16.0 | Lower than state | ||
| Daybreak | 9.9 | 7.7 | 12.4 | Lower than state | ||
| Sandy (West) | 19.0 | 15.7 | 22.7 | Similar to state | ||
| Sandy (Center) V2 | 22.4 | 18.6 | 26.7 | Similar to state | ||
| Sandy (Northeast) | 10.3 | 7.4 | 13.9 | Lower than state | ||
| Sandy (Southeast) | 7.2 | 5.2 | 9.8 | Lower than state | ||
| Draper | 14.1 | 11.8 | 16.7 | Lower than state | ||
| Riverton/Bluffdale | 11.0 | 9.1 | 13.2 | Lower than state | ||
| Herriman | 16.5 | 14.2 | 19.0 | Similar to state | ||
| Tooele County (Other) | 16.5 | 12.7 | 21.2 | Similar to state | ||
| Tooele Valley | 29.5 | 26.5 | 32.8 | Higher than state | ||
| Eagle Mountain/Cedar Valley | 14.7 | 12.1 | 17.7 | Lower than state | ||
| Lehi | 12.3 | 10.5 | 14.3 | Lower than state | ||
| Saratoga Springs | 10.2 | 8.3 | 12.4 | Lower than state | ||
| American Fork | 15.3 | 13.0 | 17.8 | Lower than state | ||
| Alpine | 8.0 | 4.6 | 12.8 | Lower than state | ||
| Pleasant Grove/Lindon | 14.7 | 12.5 | 17.2 | Lower than state | ||
| Orem (North) | 22.0 | 18.6 | 25.9 | Similar to state | ||
| Orem (West) | 19.7 | 16.8 | 23.0 | Similar to state | ||
| Orem (East) | 9.0 | 6.6 | 12.0 | Lower than state | ||
| Provo/BYU | 10.2 | 7.9 | 13.1 | Lower than state | ||
| Provo (West City Center) | 21.9 | 18.2 | 26.1 | Similar to state | ||
| Provo (East City Center) | 18.7 | 13.8 | 24.8 | Similar to state | ||
| Salem City | 9.4 | 5.7 | 14.5 | Lower than state | ||
| Spanish Fork | 14.3 | 11.8 | 17.1 | Lower than state | ||
| Springville | 14.9 | 12.2 | 18.0 | Lower than state | ||
| Mapleton | 7.3 | 4.4 | 11.5 | Lower than state | ||
| Utah County (South) V2 | 14.0 | 10.4 | 18.4 | Lower than state | ||
| Payson | 16.5 | 13.4 | 20.2 | Similar to state | ||
| Park City | 5.1 | 3.4 | 7.4 | Lower than state | ||
| Summit County (East) | 9.5 | 6.0 | 14.3 | Lower than state | ||
| Wasatch County | 12.0 | 9.6 | 14.8 | Lower than state | ||
| Daggett and Uintah County | 25.3 | 21.7 | 29.4 | Higher than state | ||
| Duchesne County | 39.9 | 33.8 | 46.8 | Higher than state | ||
| Nephi/Mona | 19.6 | 13.8 | 27.0 | Similar to state | ||
| Delta/Fillmore | 25.4 | 18.7 | 33.8 | Similar to state | ||
| Sanpete Valley | 18.0 | 14.0 | 22.7 | Similar to state | ||
| Central (Other) | 21.8 | 17.6 | 26.8 | Similar to state | ||
| Richfield/Monroe/Salina | 22.5 | 17.4 | 28.6 | Similar to state | ||
| Carbon County | 34.4 | 28.6 | 40.9 | Higher than state | ||
| Emery County | 18.8 | 12.7 | 26.6 | Similar to state | ||
| Grand County | 21.3 | 15.0 | 29.4 | Similar to state | ||
| Blanding/Monticello | 32.1 | 23.3 | 43.1 | Higher than state | ||
| San Juan County (Other) | 11.2 | 6.5 | 18.1 | Lower than state | ||
| St. George | 16.8 | 15.0 | 18.8 | Similar to state | ||
| Washington Co (Other) V2 | 12.6 | 8.0 | 18.7 | Similar to state | ||
| Washington City | 17.1 | 13.9 | 20.7 | Similar to state | ||
| Hurricane/La Verkin | 11.5 | 8.9 | 14.6 | Lower than state | ||
| Ivins/Santa Clara | 15.5 | 11.5 | 20.4 | Similar to state | ||
| Cedar City | 15.0 | 12.8 | 17.4 | Lower than state | ||
| Southwest LHD (Other) | 23.0 | 18.7 | 27.8 | Similar to state | ||
| State of Utah | 19.0 | 18.6 | 19.3 | |||
Data Notes
Asthma was identified using the National Center for Health Statistics (NCHS) 113 selected causes asthma definition. All ED encounters are included in the presented data, which includes those that were treat and release visits, as well as those that resulted in hospital admission. [[br]] [[br]]Rates were age-adjusted to the U.S. 2000 standard population. A description of the Utah Small Areas may be found on IBIS at the following URL: [https://ibis.utah.gov/ibisph-view/resource/Guidelines.html].Data Sources
- Emergency Department Encounter Database, Healthcare Information & Analysis Programs, Office of Research & Evaluation, Utah Department of Health and Human Services
- Population estimates used linear interpolation of U.S. Census Bureau, Kem C. Gardner Policy Institute population estimates, and ESRI ZIP Code data provided annual population estimates for ZIP Code areas by sex and age groups, IBIS Version 2022
Asthma-related emergency department visit average charge per visit by local health district, Utah, 2022

| Local health district | Average charge per visit | Lower Limit | Upper Limit | |||
|---|---|---|---|---|---|---|
Record Count: 14 | ||||||
| Bear River | $6,018 | $4,759 | $7,276 | |||
| Central | $4,639 | $3,746 | $5,531 | |||
| Davis County | $5,898 | $5,427 | $6,368 | |||
| Salt Lake County | $6,224 | $5,904 | $6,545 | |||
| San Juan | $3,105 | $1,850 | $4,360 | |||
| Southeast | $4,598 | $3,572 | $5,625 | |||
| Southwest | $5,430 | $4,913 | $5,947 | |||
| Summit | $6,677 | $3,650 | $9,704 | |||
| Tooele | $6,583 | $5,491 | $7,675 | |||
| TriCounty | $6,212 | $5,267 | $7,157 | |||
| Utah County | $5,797 | $5,333 | $6,261 | |||
| Wasatch | $6,112 | $4,319 | $7,906 | |||
| Weber-Morgan | $6,404 | $5,865 | $6,944 | |||
| State of Utah | $6,019 | $5,829 | $6,210 | |||
Data Notes
Asthma was identified using the National Center for Health Statistics (NCHS) 113 selected causes asthma definition. All ED encounters are included in the presented data, which includes those that were treat and release visits, as well as those that resulted in hospital admission.Data Source
Emergency Department Encounter Database, Healthcare Information & Analysis Programs, Office of Research & Evaluation, Utah Department of Health and Human ServicesAsthma-related emergency department visit average charge per visit by year, Utah, 2012-2022

| Year | Average charge per visit | Lower Limit | Upper Limit | |||
|---|---|---|---|---|---|---|
Record Count: 7 | ||||||
| 2016 | $3,915 | $3,770 | $4,060 | |||
| 2017 | $4,160 | $4,015 | $4,305 | |||
| 2018 | $4,623 | $4,388 | $4,858 | |||
| 2019 | $4,892 | $4,679 | $5,105 | |||
| 2020 | $4,918 | $4,720 | $5,116 | |||
| 2021 | $5,626 | $5,387 | $5,865 | |||
| 2022 | $6,019 | $5,829 | $6,210 | |||
Data Notes
Asthma was identified using the National Center for Health Statistics (NCHS) 113 selected causes asthma definition. All ED encounters are included in the presented data, which includes those that were treat and release visits, as well as those that resulted in hospital admission.Data Source
Emergency Department Encounter Database, Healthcare Information & Analysis Programs, Office of Research & Evaluation, Utah Department of Health and Human ServicesAsthma-related emergency department visit total charges by local health district, Utah, 2022

| Local health district | Total charges | Note | ||||
|---|---|---|---|---|---|---|
Record Count: 14 | ||||||
| Bear River | $2,021,965 | 6 | ||||
| Central | $770,001 | 7 | ||||
| Davis County | $3,880,754 | 3 | ||||
| Salt Lake County | $18,304,882 | 1 | ||||
| San Juan | $111,771 | 13 | ||||
| Southeast | $400,066 | 11 | ||||
| Southwest | $2,595,578 | 5 | ||||
| Summit | $207,000 | 10 | ||||
| Tooele | $1,533,774 | 8 | ||||
| TriCounty | $1,056,090 | 9 | ||||
| Utah County | $6,533,240 | 2 | ||||
| Wasatch | $317,849 | 12 | ||||
| Weber-Morgan | $4,643,083 | 4 | ||||
| State of Utah | $42,376,053 | |||||
Data Notes
Asthma was identified using the National Center for Health Statistics (NCHS) 113 selected causes asthma definition. All ED encounters are included in the presented data, which includes those that were treat and release visits, as well as those that resulted in hospital admission. [[br]][[br]]The numbers in the "Other" column denote the rank of the LHD based on population size. For example, number 1, Salt Lake County LHD has the largest population in Utah.Data Source
Emergency Department Encounter Database, Healthcare Information & Analysis Programs, Office of Research & Evaluation, Utah Department of Health and Human ServicesReferences and Community Resources
Utah Asthma Program[[br]] [https://asthma.utah.gov/][[br]][[br]] Asthma and Allergy Foundation of America[[br]] [http://www.aafa.org][[br]][[br]] American Lung Association[[br]] [http://www.lung.org][[br]] [[br]] Asthma and outdoor air pollution:[[br]] [https://www.airnow.gov/sites/default/files/2018-03/asthma-flyer_0.pdf][[br]] [https://air.utah.gov/][[br]][[br]] Utah Tobacco Control and Prevention Quitting Resources[[br]] [http://www.waytoquit.org]More Resources and Links
Evidence-based community health improvement ideas and interventions may be found at the following sites:Additional indicator data by state and county may be found on these Websites:
- CDC Prevention Status Reports for all 50 states
- County Health Rankings
- Kaiser Family Foundation's StateHealthFacts.org
- CDC WONDER DATA2010, the Healthy People 2010 Database.
Medical literature can be queried at the PubMed website.
Page Content Updated On 08/07/2024,
Published on 09/11/2024
