
- Important Facts
- Data Views
- lifetime prevalence among adults aged 18 and older, Utah and U.S., 2021-2022
- by disability, Utah adults aged 18 and older, 2022
- Utah and U.S., 2001-2022
- by age and sex, Utah, 2022
- by ethnicity, Utah, 2021-2022
- by race, Utah, 2021-2022
- by educational level, Utah, 2021-2022
- by income level, Utah, 2021-2022
- by local health district, Utah 2021-2022 and U.S. 2022
- by local health district, all ages, Utah, 2022
- by Utah Small Area, 2018-2022
- Related Indicators
- Available Services
- Other Resources & Links
- Full Report
- Main XML Data
- Values XML Data


Complete Health Indicator Report of Asthma: Adult Prevalence
Definition
Adults aged 18+ (unless otherwise noted), who reported having been told by a doctor that they have asthma and who currently have asthma.Numerator
Total number of respondents answering "yes" to both of the BRFSS asthma core questions:[[br]] 1. Have you ever been told by a doctor, nurse, or other health professional that you had asthma?[[br]] 2. Do you still have asthma?Denominator
Includes all survey respondents ages 18 years and older except those with missing, don't know, or refused answers to the core asthma questions.Data Interpretation Issues
Beginning in 2011, BRFSS data include both landline and cell phone respondent data along with a new weighting methodology called iterative proportional fitting, or raking. This methodology utilizes additional demographic information (such as education, race, and marital status) in the weighting procedure. Both of these methodology changes were implemented to account for an increased number of U.S. households without landline phones and an under-representation of certain demographic groups that were not well-represented in the sample. More details about these changes can be found at: [https://ibis.utah.gov/ibisph-view/pdf/opha/resource/brfss/RakingImpact2011.pdf].Why Is This Important?
Asthma is a serious personal and public health issue that has far reaching medical, economic, and psychosocial implications. The burden of asthma can be seen in the number of asthma-related medical events, including emergency department visits, hospitalizations, and deaths.How Are We Doing?
Adult asthma rates show no sign of declining in Utah or in the U.S. In Utah and the U.S., adult asthma prevalence is higher for women than men in almost every age category.How Do We Compare With the U.S.?
In 2022, Utah had a higher adult asthma prevalence rate when compared to the national average (10.9% vs. 10.0%).What Is Being Done?
The Utah Asthma Program (UAP) works with the Utah Asthma Task Force and other partners to maximize the reach, impact, efficiency, and sustainability of comprehensive asthma control services in Utah. This is accomplished by providing a seamless alignment of asthma services across the public health and health care sector, ensuring that people with asthma receive all of the services they need. The UAP focuses on building program infrastructure and implementing strategies that improve asthma control, reduce asthma-related emergency department visits and hospitalizations, and reduce health care costs. Program infrastructure is strengthened through a focus on strategies to create and support a comprehensive asthma control program, these strategies include: strengthening leadership, building strategic partnerships, and using strategic communication, surveillance, and evaluation. In addition, the UAP implements strategies outlined in the Centers for Disease Control and Prevention (CDC) EXHALE technical package to improve asthma control. The six strategy areas outlined in the EXHALE technical package are:[[br]] 1. Education on asthma self-management.[[br]] 2. e-Xtinguishing smoking and secondhand smoke.[[br]] 3. Home visits for trigger reduction and asthma self-management.[[br]] 4. Achievement of guidelines-based medical management.[[br]] 5. Linkages and coordination of care across settings.[[br]] 6. Environmental policies or best practices to reduce asthma triggers from indoor, outdoor, and occupational sources. These strategies are expected to improve asthma control and quality of life by increasing access to health care and increasing coordination and coverage for comprehensive asthma control services both in the public health and health care sectors. Specifically, these strategies include identifying people with poorly controlled asthma, linking them to health care providers and NAEPP EPR-3 guidelines-based care, educating them on asthma self-management strategies, providing a supportive school environment, and referring to or providing home trigger reduction services for those who need them.Available Services
A list of Utah Asthma Program services for clinicians, community health workers, and people with asthma can be found at [https://asthma.utah.gov/]Health Program Information
Utah Asthma Program website: [https://asthma.utah.gov/] CDC EXHALE package: [https://www.cdc.gov/national-asthma-control-program/php/exhale/index.html]Related Indicators
Related Relevant Population Characteristics Indicators:
Risk Factors
People with respiratory diseases, including asthma, that make their lungs more vulnerable to ozone may experience health effects earlier and at lower ozone levels than other people. When ozone levels are high, more people with asthma have attacks that require a doctor's attention or use of medication. One reason this happens is that ozone makes people more sensitive to allergens such as pets, pollen, and dust mites, which are common triggers of asthma attacks.Related Risk Factors Indicators:
Related Health Status Outcomes Indicators:
Graphical Data Views
Asthma lifetime prevalence among adults aged 18 and older, Utah and U.S., 2021-2022

| Utah vs. U.S. | Year | Age-adjusted percentage of adults | Lower Limit | Upper Limit | ||
|---|---|---|---|---|---|---|
Record Count: 4 | ||||||
| Utah | 2021 | 14.9% | 14.0% | 15.8% | ||
| Utah | 2022 | 16.9% | 15.9% | 17.9% | ||
| U.S. | 2021 | 14.6% | 14.4% | 14.8% | ||
| U.S. | 2022 | 15.2% | 15.0% | 15.4% | ||
Data Notes
Rates have been age-adjusted to the U.S. 2000 standard population. Note: At the time of this update, the BRFSS U.S. dataset did not include an age variable but did include five age categories up to age 80+ (vs. the typical weighting scheme that includes 85+). Comparisons with both weighting schemes were compared using Utah data, and the difference was about 1/100 of a percentage point. In 2011, the BRFSS changed its methodology from a landline only sample and weighting based on post-stratification to a landline/cell phone sample and raking as the weighting methodology. Raking accounts for variables such as income, education, marital status, and home ownership during weighting and has the potential to more accurately reflect the population distribution.Data Sources
- Utah Department of Health and Human Services Behavioral Risk Factor Surveillance System (BRFSS) [https://ibis.utah.gov/ibisph-view/query/selection/brfss/BRFSSSelection.html]
- Behavioral Risk Factor Surveillance System Survey Data, US Department of Health and Human Services Centers for Disease Control and Prevention (CDC).
Asthma prevalence by disability, Utah adults aged 18 and older, 2022

| Disability type | Age-adjusted percentage of adults | Lower Limit | Upper Limit | |||
|---|---|---|---|---|---|---|
Record Count: 7 | ||||||
| Cognitive disability | 22.0% | 18.9% | 25.3% | |||
| Mobility disability | 26.8% | 21.5% | 32.7% | |||
| Self-care disability | 32.4% | 24.5% | 41.5% | |||
| Independent living disability | 21.5% | 17.1% | 26.6% | |||
| Difficulty seeing or blind | 16.5% | 11.0% | 23.9% | |||
| Difficulty hearing or deaf | 22.9% | 16.7% | 30.5% | |||
| No disability | 8.4% | 7.6% | 9.3% | |||
Data Notes
Rates have been age-adjusted to the U.S. 2000 standard population.Data Source
Utah Department of Health and Human Services Behavioral Risk Factor Surveillance System (BRFSS) [https://ibis.utah.gov/ibisph-view/query/selection/brfss/BRFSSSelection.html]Asthma prevalence among adults aged 18 and older, Utah and U.S., 2001-2022

| BRFSS Utah vs. U.S. | Year | Age-adjusted percentage of adults | Lower Limit | Upper Limit | ||
|---|---|---|---|---|---|---|
Record Count: 46 | ||||||
| UT Old Methodology | 2001 | 7.0% | 5.9% | 8.0% | ||
| UT Old Methodology | 2002 | 7.9% | 6.8% | 9.0% | ||
| UT Old Methodology | 2003 | 7.1% | 6.0% | 8.1% | ||
| UT Old Methodology | 2004 | 8.0% | 7.1% | 8.9% | ||
| UT Old Methodology | 2005 | 7.8% | 7.0% | 8.8% | ||
| UT Old Methodology | 2006 | 8.3% | 7.4% | 9.3% | ||
| UT Old Methodology | 2007 | 8.2% | 7.3% | 9.2% | ||
| UT Old Methodology | 2008 | 8.4% | 7.5% | 9.5% | ||
| UT Old Methodology | 2009 | 7.9% | 7.3% | 8.6% | ||
| UT Old Methodology | 2010 | 9.0% | 8.2% | 9.8% | ||
| US Old Methodology | 2001 | 7.2% | 7.0% | 7.4% | ||
| US Old Methodology | 2002 | 7.5% | 7.3% | 7.6% | ||
| US Old Methodology | 2003 | 7.7% | 7.5% | 7.9% | ||
| US Old Methodology | 2004 | 8.3% | 8.1% | 7.9% | ||
| US Old Methodology | 2005 | 7.8% | 7.7% | 8.0% | ||
| US Old Methodology | 2006 | 8.2% | 8.0% | 8.4% | ||
| US Old Methodology | 2007 | 8.2% | 8.1% | 8.4% | ||
| US Old Methodology | 2008 | 8.5% | 8.3% | 8.7% | ||
| US Old Methodology | 2009 | 8.5% | 8.3% | 8.7% | ||
| US Old Methodology | 2010 | 8.7% | 8.5% | 8.8% | ||
| UT New Methodology | 2009 | 8.3% | 7.6% | 9.0% | ||
| UT New Methodology | 2010 | 8.7% | 8.1% | 9.4% | ||
| UT New Methodology | 2011 | 8.7% | 8.0% | 9.3% | ||
| UT New Methodology | 2012 | 8.9% | 8.3% | 9.6% | ||
| UT New Methodology | 2013 | 9.1% | 8.5% | 9.7% | ||
| UT New Methodology | 2014 | 8.7% | 8.2% | 9.2% | ||
| UT New Methodology | 2015 | 9.0% | 8.4% | 9.7% | ||
| UT New Methodology | 2016 | 8.3% | 7.6% | 9.0% | ||
| UT New Methodology | 2017 | 8.8% | 8.2% | 9.5% | ||
| UT New Methodology | 2018 | 9.3% | 8.6% | 10.0% | ||
| UT New Methodology | 2019 | 9.9% | 9.2% | 10.6% | ||
| UT New Methodology | 2020 | 10.8% | 10.1% | 11.5% | ||
| UT New Methodology | 2021 | 9.7% | 9.0% | 10.5% | ||
| UT New Methodology | 2022 | 10.9% | 10.1% | 11.8% | ||
| US New Methodology | 2011 | 8.7% | 8.6% | 8.9% | ||
| US New Methodology | 2012 | 8.8% | 8.6% | 9.0% | ||
| US New Methodology | 2013 | 8.9% | 8.7% | 9.1% | ||
| US New Methodology | 2014 | 8.9% | 8.7% | 9.1% | ||
| US New Methodology | 2015 | 8.8% | 8.6% | 9.0% | ||
| US New Methodology | 2016 | 8.9% | 8.7% | 9.1% | ||
| US New Methodology | 2017 | 9.0% | 8.9% | 9.2% | ||
| US New Methodology | 2018 | 9.3% | 9.1% | 9.4% | ||
| US New Methodology | 2019 | 9.0% | 8.8% | 9.2% | ||
| US New Methodology | 2020 | 9.2% | 9.0% | 9.4% | ||
| US New Methodology | 2021 | 9.8% | 9.6% | 10.0% | ||
| US New Methodology | 2022 | 10.0% | 9.8% | 10.2% | ||
Data Notes
Rates have been age-adjusted to the U.S. 2000 standard population. Note: At the time of this update, the BRFSS U.S. dataset did not include an age variable but did include five age categories up to age 80+ (vs. the typical weighting scheme that includes 85+). Comparisons with both weighting schemes were compared using Utah data, and the difference was about 1/100 of a percentage point. In 2011, the BRFSS changed its methodology from a landline only sample and weighting based on post-stratification to a landline/cell phone sample and raking as the weighting methodology. Raking accounts for variables such as income, education, marital status, and home ownership during weighting and has the potential to more accurately reflect the population distribution.Data Sources
- Utah Department of Health and Human Services Behavioral Risk Factor Surveillance System (BRFSS) [https://ibis.utah.gov/ibisph-view/query/selection/brfss/BRFSSSelection.html]
- Behavioral Risk Factor Surveillance System Survey Data, US Department of Health and Human Services Centers for Disease Control and Prevention (CDC).
Adult asthma prevalence by age and sex, Utah, 2022

| Males vs. Females | Age group | Percentage of adults | Lower Limit | Upper Limit | ||
|---|---|---|---|---|---|---|
Record Count: 12 | ||||||
| Male | 18-34 | 8.7% | 7.0% | 10.9% | ||
| Male | 35-49 | 7.5% | 6.0% | 9.5% | ||
| Male | 50-64 | 8.2% | 6.5% | 10.2% | ||
| Male | 65+ | 8.4% | 6.6% | 10.5% | ||
| Female | 18-34 | 14.9% | 12.2% | 18.1% | ||
| Female | 35-49 | 12.3% | 10.3% | 14.6% | ||
| Female | 50-64 | 15.5% | 12.9% | 18.4% | ||
| Female | 65+ | 11.9% | 9.8% | 14.4% | ||
| Total | 18-34 | 11.7% | 10.1% | 13.6% | ||
| Total | 35-49 | 9.9% | 8.6% | 11.4% | ||
| Total | 50-64 | 11.8% | 10.3% | 13.6% | ||
| Total | 65+ | 10.3% | 8.8% | 11.9% | ||
Data Source
Utah Department of Health and Human Services Behavioral Risk Factor Surveillance System (BRFSS) [https://ibis.utah.gov/ibisph-view/query/selection/brfss/BRFSSSelection.html]Adult asthma prevalence by ethnicity, Utah, 2021-2022

| Hispanic ethnicity | Age-adjusted percentage of adults | Lower Limit | Upper Limit | |||
|---|---|---|---|---|---|---|
Record Count: 3 | ||||||
| Hispanic/Latino | 7.2% | 6.0% | 8.6% | |||
| Non-Hispanic/Latino | 10.8% | 10.3% | 11.5% | |||
| All ethnicities | 10.3% | 9.8% | 10.9% | |||
Data Notes
Rates have been age-adjusted to the U.S. 2000 standard population.Data Source
Utah Department of Health and Human Services Behavioral Risk Factor Surveillance System (BRFSS) [https://ibis.utah.gov/ibisph-view/query/selection/brfss/BRFSSSelection.html]Adult asthma prevalence by race, Utah, 2021-2022

| Race | Age-adjusted percentage of adults | Lower Limit | Upper Limit | Note | ||
|---|---|---|---|---|---|---|
Record Count: 6 | ||||||
| American Indian/Alaska Native | 11.9% | 7.8% | 17.8% | |||
| Asian | 6.6% | 3.9% | 10.9% | |||
| Black, African American | 11.3% | 6.7% | 18.4% | |||
| Native Hawaiian, Pacific Islander | 8.6% | 4.2% | 16.7% | * | ||
| White | 10.9% | 10.3% | 11.5% | |||
| All races | 10.4% | 9.8% | 10.9% | |||
Data Notes
*Use caution in interpreting. The estimate has a coefficient of variation >30% and is therefore deemed unreliable by Utah Department of Health and Human Services standards. Rates have been age-adjusted to the U.S. 2000 standard population based on 3 age groups: 18-34, 35-49, and 50+.Data Source
Utah Department of Health and Human Services Behavioral Risk Factor Surveillance System (BRFSS) [https://ibis.utah.gov/ibisph-view/query/selection/brfss/BRFSSSelection.html]Asthma prevalence among adults ages 25 and older by educational level, Utah, 2021-2022

| Education level | Age-adjusted percentage of adults ages 25+ | Lower Limit | Upper Limit | |||
|---|---|---|---|---|---|---|
Record Count: 5 | ||||||
| Less than high school | 7.9% | 6.1% | 10.2% | |||
| H.S. grad or G.E.D. | 10.3% | 9.1% | 11.5% | |||
| Some post high school | 11.3% | 10.3% | 12.4% | |||
| College graduate | 9.2% | 8.5% | 10.0% | |||
| Total | 10.1% | 9.5% | 10.6% | |||
Data Notes
Rates have been age-adjusted to the U.S. 2000 standard population. Only adults ages 25 and older were included in the analysis.Data Source
Utah Department of Health and Human Services Behavioral Risk Factor Surveillance System (BRFSS) [https://ibis.utah.gov/ibisph-view/query/selection/brfss/BRFSSSelection.html]Adult asthma prevalence by income level, Utah, 2021-2022

| Income category | Age-adjusted percentage of adults | Lower Limit | Upper Limit | |||
|---|---|---|---|---|---|---|
Record Count: 5 | ||||||
| <$25,000 | 13.8% | 11.7% | 16.2% | |||
| $25,000-$49,999 | 11.8% | 10.4% | 13.3% | |||
| $50,000-$74,999 | 10.8% | 9.3% | 12.5% | |||
| $75,000+ | 9.3% | 8.4% | 10.2% | |||
| Total | 10.3% | 9.8% | 10.9% | |||
Data Notes
Rates have been age-adjusted to the U.S. 2000 standard population.Data Source
Utah Department of Health and Human Services Behavioral Risk Factor Surveillance System (BRFSS) [https://ibis.utah.gov/ibisph-view/query/selection/brfss/BRFSSSelection.html]Adult asthma prevalence by local health district, Utah 2021-2022 and U.S. 2022

| Local health district | Age-adjusted percentage of adults | Lower Limit | Upper Limit | Note | ||
|---|---|---|---|---|---|---|
Record Count: 15 | ||||||
| Bear River | 10.6% | 8.5% | 13.1% | |||
| Central | 11.2% | 8.6% | 14.5% | |||
| Davis County | 10.5% | 8.8% | 12.4% | |||
| Salt Lake County | 9.9% | 9.1% | 10.9% | |||
| San Juan | 11.8% | 6.5% | 20.5% | * | ||
| Southeast | 14.1% | 10.3% | 19.2% | |||
| Southwest | 9.7% | 7.8% | 12.1% | |||
| Summit | 12.8% | 8.2% | 19.5% | |||
| Tooele | 10.7% | 8.0% | 14.1% | |||
| TriCounty | 13.0% | 10.0% | 16.8% | |||
| Utah County | 10.3% | 9.1% | 11.6% | |||
| Wasatch | 9.4% | 5.7% | 15.1% | |||
| Weber-Morgan | 11.6% | 9.6% | 13.8% | |||
| State of Utah | 10.3% | 9.8% | 10.9% | |||
| U.S. | 10.0% | 9.8% | 10.2% | 2022 data | ||
Prevalence of current asthma by local health district, Utah, 2021-2022
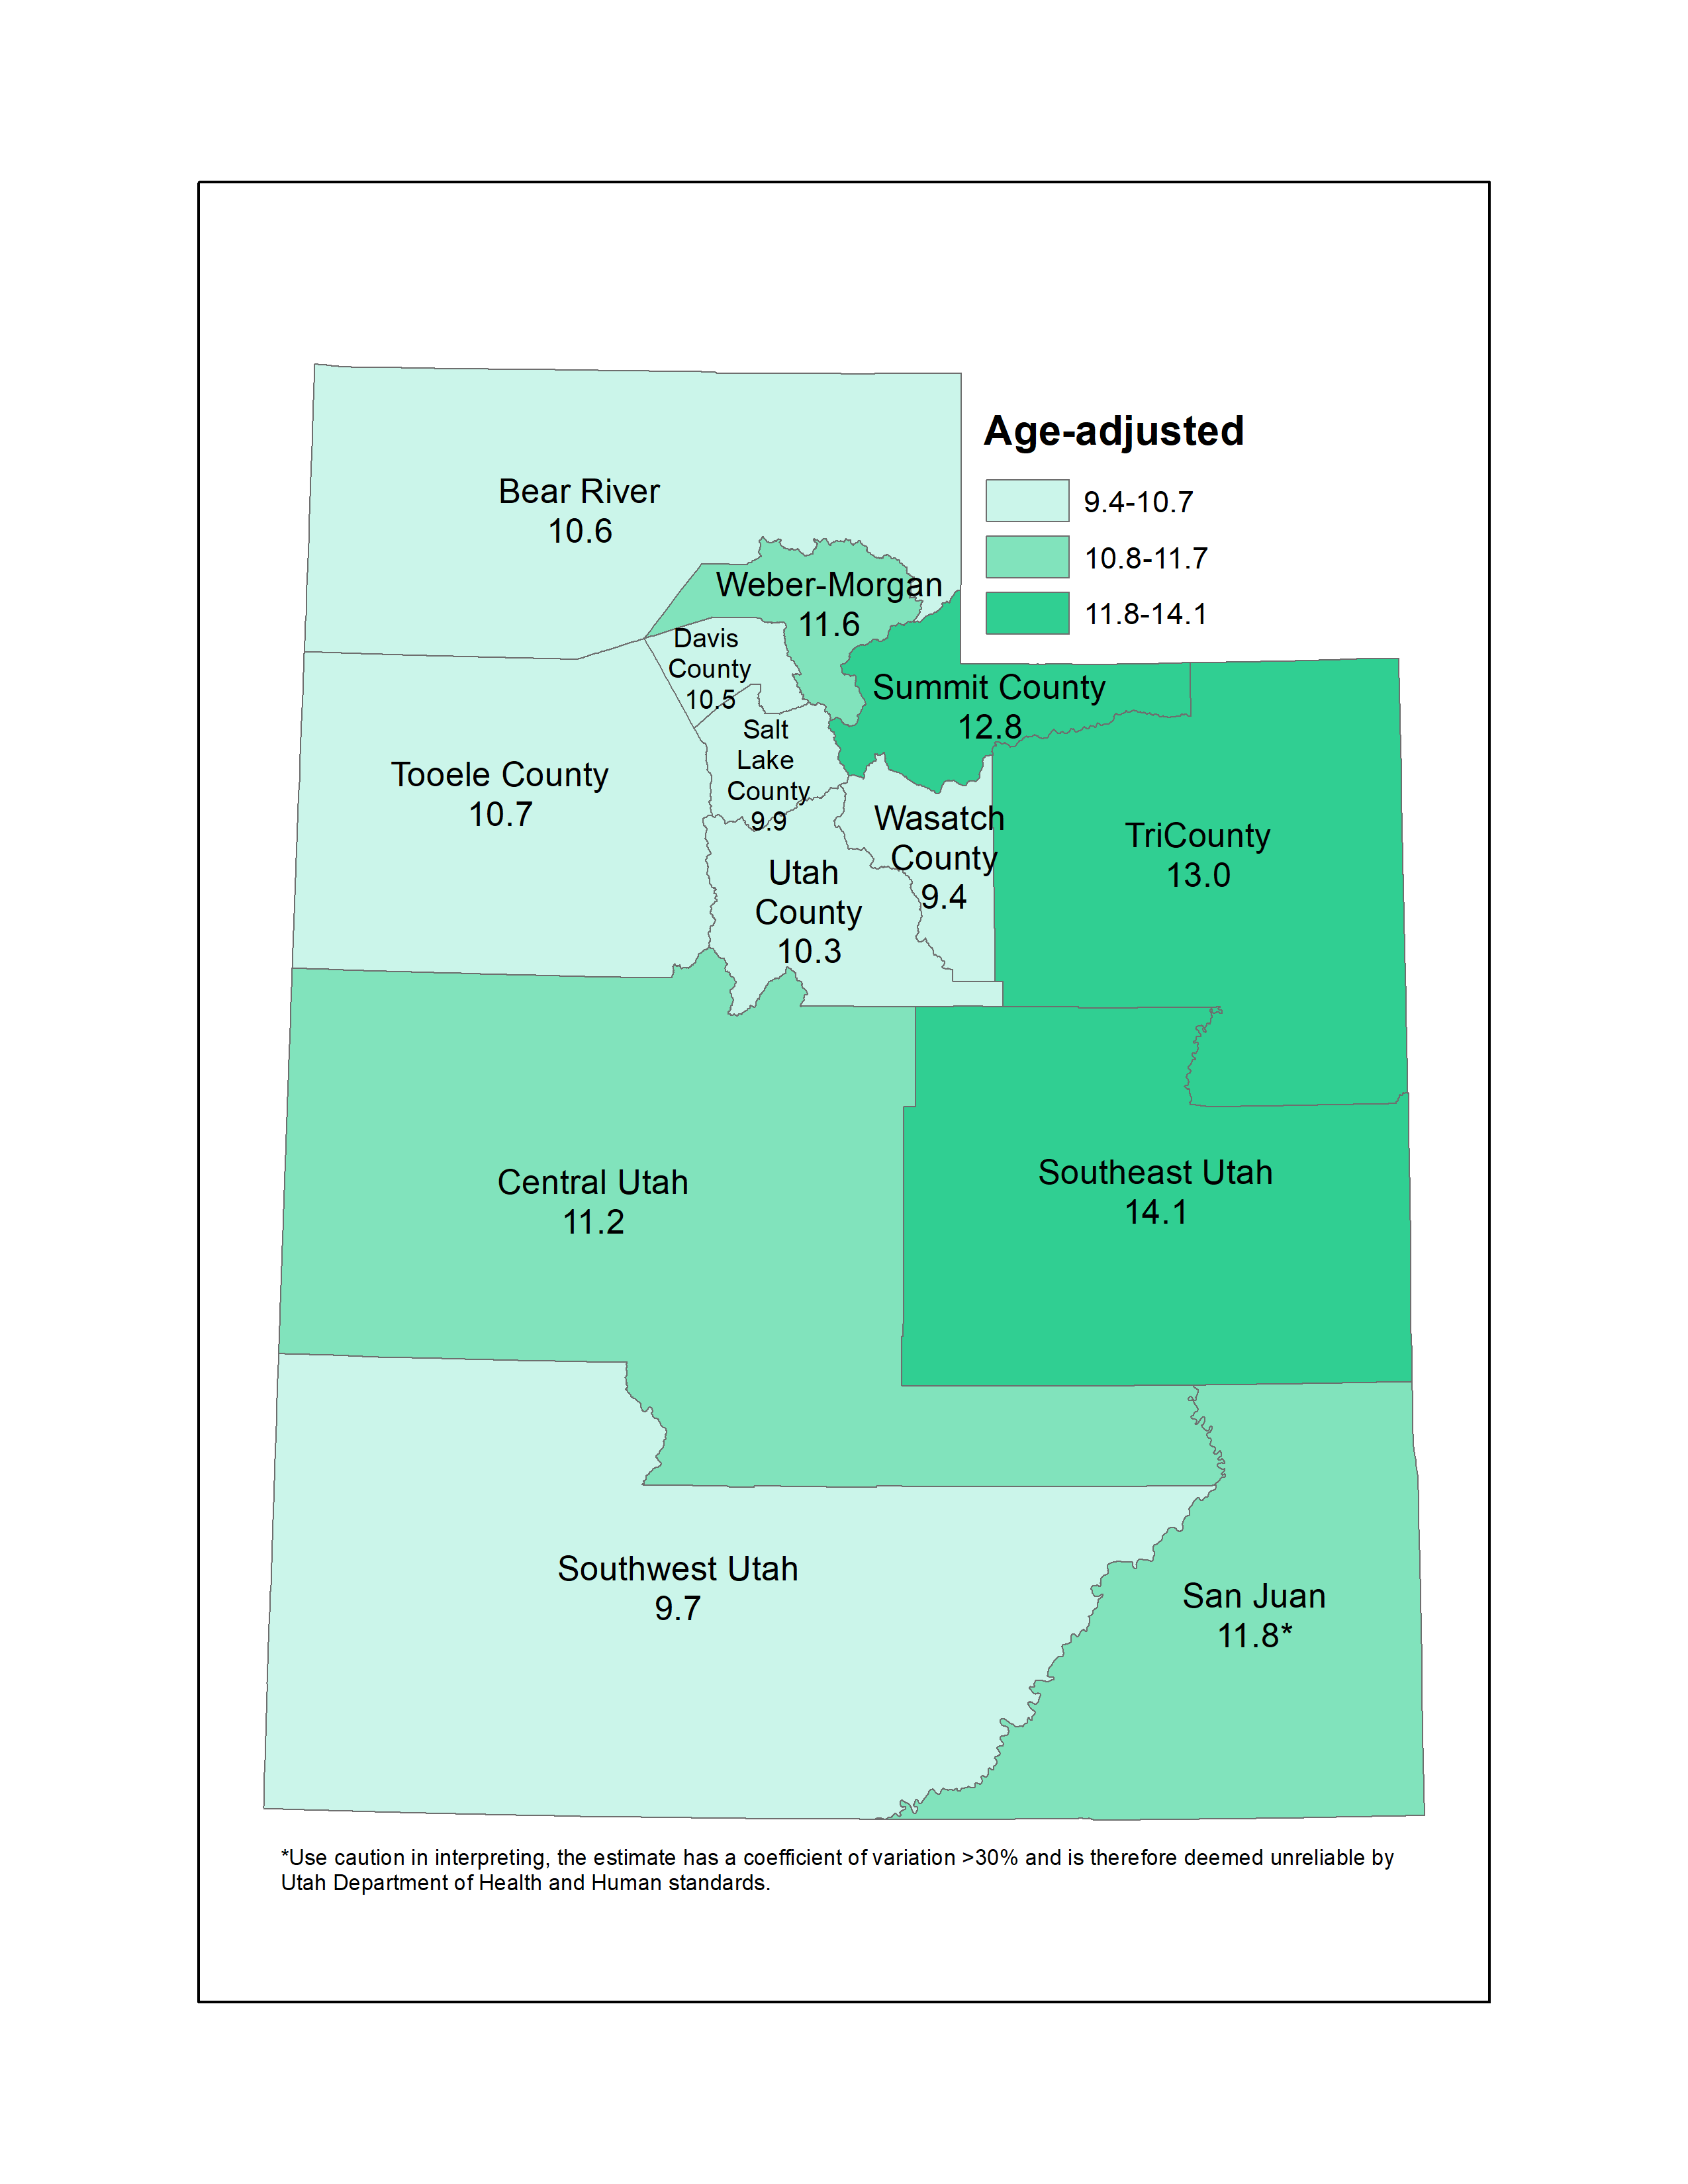
This map was made using an interval break method called "natural breaks" where classes are based on natural groupings inherent in the data.
Data Notes
*Use caution in interpreting. The estimate has a coefficient of variation >30% and is therefore deemed unreliable by Utah Department of Health and Human Services standards. Percentages have been age-adjusted to the U.S. 2000 standard population.Data Sources
- Utah Department of Health and Human Services Behavioral Risk Factor Surveillance System (BRFSS) [https://ibis.utah.gov/ibisph-view/query/selection/brfss/BRFSSSelection.html]
- Behavioral Risk Factor Surveillance System Survey Data, US Department of Health and Human Services Centers for Disease Control and Prevention (CDC).
Asthma prevalence by local health district, all ages, Utah, 2022

| Local health district | Age-adjusted percentage of persons (all ages) | Lower Limit | Upper Limit | Note | ||
|---|---|---|---|---|---|---|
Record Count: 14 | ||||||
| Bear River | 9.8% | 7.4% | 12.9% | |||
| Central | 11.3% | 8.2% | 15.4% | |||
| Davis County | 10.4% | 8.1% | 13.2% | |||
| Salt Lake County | 10.7% | 9.3% | 12.3% | |||
| San Juan | 8.3% | 3.2% | 20.2% | * | ||
| Southeast | 12.9% | 8.9% | 18.4% | |||
| Southwest | 7.6% | 5.8% | 10.0% | |||
| Summit | 10.0% | 6.1% | 16.0% | |||
| Tooele | 9.4% | 6.4% | 13.7% | |||
| TriCounty | 10.2% | 7.2% | 14.3% | |||
| Utah County | 9.6% | 8.1% | 11.2% | |||
| Wasatch | 7.9% | 4.8% | 12.8% | |||
| Weber-Morgan | 11.0% | 8.7% | 13.7% | |||
| State of Utah | 10.1% | 9.4% | 10.9% | |||
Data Notes
All ages prevalence includes adult-reported children and self-reported adults who have been told by a doctor that they have asthma and who currently have asthma. *Use caution in interpreting, the estimate has a coefficient of variation >30% and is therefore deemed unreliable by Utah Department of Health and Human Services standards.Data Source
Utah Department of Health and Human Services Behavioral Risk Factor Surveillance System (BRFSS) [https://ibis.utah.gov/ibisph-view/query/selection/brfss/BRFSSSelection.html]Current doctor-diagnosed asthma by Utah Small Area, 2018-2022

| Utah Small Areas | Age-adjusted percentage of adults | Lower Limit | Upper Limit | Note | ||
|---|---|---|---|---|---|---|
Record Count: 100 | ||||||
| Brigham City | 13.6% | 9.8% | 18.7% | Similar to state | ||
| Box Elder Co (Other) V2 | 14.3% | 9.6% | 20.8% | Similar to state | ||
| Tremonton | 10.5% | 7.0% | 15.4% | Similar to state | ||
| Logan V2 | 9.9% | 7.7% | 12.6% | Similar to state | ||
| North Logan | 10.4% | 6.9% | 15.5% | Similar to state | ||
| Cache (Other)/Rich (All) V2 | 6.7% | 4.4% | 10.2% | Similar to state | ||
| Hyrum | 12.5% | 7.5% | 20.1% | Similar to state | ||
| Smithfield | 9.8% | 6.1% | 15.3% | Similar to state | ||
| Ben Lomond | 9.0% | 7.1% | 11.3% | Similar to state | ||
| Weber County (East) | 8.8% | 6.5% | 11.8% | Similar to state | ||
| Morgan County | 7.7% | 3.3% | 17.0% | *Similar to state | ||
| Ogden (Downtown) | 11.5% | 8.8% | 14.9% | Similar to state | ||
| South Ogden | 13.0% | 10.0% | 16.6% | Similar to state | ||
| Roy/Hooper | 14.4% | 11.1% | 18.6% | Higher than state | ||
| Riverdale | 14.0% | 10.1% | 18.9% | Higher than state | ||
| Clearfield Area/Hooper | 11.8% | 9.4% | 14.6% | Similar to state | ||
| Layton/South Weber | 11.4% | 9.4% | 13.8% | Similar to state | ||
| Kaysville/Fruit Heights | 11.7% | 8.7% | 15.7% | Similar to state | ||
| Syracuse | 9.2% | 6.2% | 13.5% | Similar to state | ||
| Centerville | 12.1% | 7.9% | 18.3% | Similar to state | ||
| Farmington | 9.5% | 6.4% | 14.0% | Similar to state | ||
| North Salt Lake | 9.8% | 5.5% | 16.7% | *Similar to state | ||
| Woods Cross/West Bountiful | 7.4% | 4.2% | 12.5% | Similar to state | ||
| Bountiful | 10.3% | 7.7% | 13.6% | Similar to state | ||
| SLC (Rose Park) | 9.0% | 6.1% | 13.0% | Similar to state | ||
| SLC (Avenues) | 9.1% | 5.8% | 13.9% | Similar to state | ||
| SLC (Foothill/East Bench) | 11.5% | 7.4% | 17.3% | Similar to state | ||
| Magna | 9.4% | 6.7% | 13.1% | Similar to state | ||
| SLC (Glendale) V2 | 9.0% | 5.6% | 14.1% | Similar to state | ||
| West Valley (Center) | 8.2% | 6.0% | 11.2% | Similar to state | ||
| West Valley (West) V2 | 8.2% | 5.4% | 12.3% | Similar to state | ||
| West Valley (East) V2 | 9.3% | 7.0% | 12.3% | Similar to state | ||
| SLC (Downtown) V2 | 11.9% | 8.8% | 15.9% | Similar to state | ||
| SLC (Southeast Liberty) | 8.5% | 5.5% | 12.9% | Similar to state | ||
| South Salt Lake | 8.0% | 5.4% | 11.7% | Similar to state | ||
| SLC (Sugar House) | 10.6% | 7.5% | 14.7% | Similar to state | ||
| Millcreek (South) | 5.7% | 3.4% | 9.4% | Lower than state | ||
| Millcreek (East) | 8.8% | 5.9% | 12.8% | Similar to state | ||
| Holladay V2 | 17.1% | 11.2% | 25.1% | Higher than state | ||
| Cottonwood | 7.9% | 5.5% | 11.1% | Similar to state | ||
| Kearns V2 | 15.9% | 12.2% | 20.4% | Higher than state | ||
| Taylorsville (E)/Murray (W) | 10.1% | 7.5% | 13.4% | Similar to state | ||
| Taylorsville (West) | 10.9% | 7.9% | 14.8% | Similar to state | ||
| Murray | 11.0% | 8.3% | 14.4% | Similar to state | ||
| Midvale | 9.4% | 6.9% | 12.9% | Similar to state | ||
| West Jordan (Northeast) V2 | 16.9% | 12.7% | 22.0% | Higher than state | ||
| West Jordan (Southeast) | 10.8% | 7.8% | 14.6% | Similar to state | ||
| West Jordan (W)/Copperton | 8.0% | 5.7% | 11.2% | Similar to state | ||
| South Jordan V2 | 11.7% | 8.7% | 15.5% | Similar to state | ||
| Daybreak | 10.4% | 7.4% | 14.5% | Similar to state | ||
| Sandy (West) | 9.0% | 6.4% | 12.6% | Similar to state | ||
| Sandy (Center) V2 | 13.1% | 9.4% | 17.8% | Similar to state | ||
| Sandy (Northeast) | 9.9% | 6.3% | 15.2% | Similar to state | ||
| Sandy (Southeast) | 10.5% | 7.3% | 15.0% | Similar to state | ||
| Draper | 11.2% | 8.3% | 15.0% | Similar to state | ||
| Riverton/Bluffdale | 10.3% | 7.6% | 14.0% | Similar to state | ||
| Herriman | 9.1% | 6.8% | 12.1% | Similar to state | ||
| Tooele County (Other) | 12.0% | 8.3% | 17.0% | Similar to state | ||
| Tooele Valley | 11.7% | 9.7% | 14.1% | Similar to state | ||
| Eagle Mountain/Cedar Valley | 6.4% | 4.4% | 9.2% | Lower than state | ||
| Lehi | 9.6% | 7.5% | 12.2% | Similar to state | ||
| Saratoga Springs | 10.0% | 7.0% | 14.0% | Similar to state | ||
| American Fork | 8.8% | 6.3% | 12.0% | Similar to state | ||
| Alpine | 6.8% | 3.2% | 13.9% | *Similar to state | ||
| Pleasant Grove/Lindon | 10.1% | 7.9% | 12.8% | Similar to state | ||
| Orem (North) | 8.2% | 5.9% | 11.2% | Similar to state | ||
| Orem (West) | 7.7% | 5.6% | 10.6% | Similar to state | ||
| Orem (East) | 6.9% | 4.3% | 10.9% | Similar to state | ||
| Provo/BYU | 9.6% | 7.2% | 12.6% | Similar to state | ||
| Provo (West City Center) | 11.6% | 8.3% | 15.9% | Similar to state | ||
| Provo (East City Center) | 11.4% | 7.3% | 17.3% | Similar to state | ||
| Salem City | ** | ** | ||||
| Spanish Fork | 8.2% | 5.9% | 11.1% | Similar to state | ||
| Springville | 10.5% | 7.8% | 14.1% | Similar to state | ||
| Mapleton | 14.9% | 8.8% | 24.3% | *Similar to state | ||
| Utah County (South) V2 | 11.2% | 7.1% | 17.4% | Similar to state | ||
| Payson | 10.1% | 6.9% | 14.6% | Similar to state | ||
| Park City | 9.1% | 6.3% | 13.2% | Similar to state | ||
| Summit County (East) | 11.0% | 7.3% | 16.2% | Similar to state | ||
| Wasatch County | 7.4% | 5.4% | 10.0% | Lowe than state | ||
| Daggett and Uintah County | 11.4% | 9.4% | 13.6% | Similar to state | ||
| Duchesne County | 10.3% | 7.7% | 13.5% | Similar to state | ||
| Nephi/Mona | 10.3% | 5.9% | 17.4% | Similar to state | ||
| Delta/Fillmore | 10.9% | 7.0% | 16.5% | Similar to state | ||
| Sanpete Valley | 11.3% | 8.1% | 15.7% | Similar to state | ||
| Central (Other) | 11.1% | 8.5% | 14.4% | Similar to state | ||
| Richfield/Monroe/Salina | 12.3% | 8.9% | 16.6% | Similar to state | ||
| Carbon County | 15.3% | 12.4% | 18.7% | Higher than state | ||
| Emery County | 11.3% | 7.6% | 16.5% | Similar to state | ||
| Grand County | 7.8% | 4.3% | 13.8% | *Similar to state | ||
| Blanding/Monticello | 6.8% | 4.4% | 10.3% | Similar to state | ||
| San Juan County (Other) | 7.1% | 3.6% | 13.5% | *Similar to state | ||
| St. George | 10.0% | 7.9% | 12.6% | Similar to state | ||
| Washington Co (Other) V2 | 5.3% | 2.7% | 10.0% | *Lower than state | ||
| Washington City | 9.1% | 6.2% | 13.3% | Similar to state | ||
| Hurricane/La Verkin | 9.6% | 6.5% | 13.9% | Similar to state | ||
| Ivins/Santa Clara | 5.3% | 2.3% | 11.6% | *Similar to state | ||
| Cedar City | 11.4% | 8.4% | 15.3% | Similar to state | ||
| Southwest LHD (Other) | 7.6% | 5.3% | 10.6% | Similar to state | ||
| State of Utah | 10.1% | 9.8% | 10.5% | |||
Data Notes
Age-adjusted to U.S. 2000 standard population. A description of the Utah Small Areas may be found on IBIS at the following URL: [https://ibis.utah.gov/ibisph-view/resource/Guidelines.html]. *Use caution in interpreting. The estimate has a coefficient of variation >30% and is therefore deemed unreliable by Utah Department of Health and Human Services standards. Comparison to the state rate is statistically different for areas that are higher or lower than state in the "Note" column.Data Source
Utah Department of Health and Human Services Behavioral Risk Factor Surveillance System (BRFSS) [https://ibis.utah.gov/ibisph-view/query/selection/brfss/BRFSSSelection.html]References and Community Resources
The Utah Asthma Program (UAP) provides data, information and education for those with asthma, physicians, and healthcare providers (e.g. school nurses, community health workers, etc.) on the UAP website: [https://asthma.utah.gov/] CDC EXHALE package: [https://www.cdc.gov/national-asthma-control-program/php/exhale/index.html] Community Resources Asthma and Allergy Foundation of America: [http://www.aafa.org] American Lung Association: [https://www.lung.org/lung-health-diseases/lung-disease-lookup/asthma] Asthma and Utah outdoor air pollution: [https://air.utah.gov/forecastLegendAQI.html#Health] Check Utah air quality: [https://air.utah.gov/]More Resources and Links
Evidence-based community health improvement ideas and interventions may be found at the following sites:Additional indicator data by state and county may be found on these Websites:
- CDC Prevention Status Reports for all 50 states
- County Health Rankings
- Kaiser Family Foundation's StateHealthFacts.org
- CDC WONDER DATA2010, the Healthy People 2010 Database.
Medical literature can be queried at the PubMed website.
Page Content Updated On 08/06/2024,
Published on 09/24/2024
